Measure Stage
Develop process measures – How do you measure the problem?
Collect process data - When and where does the data come from?
KPIs for a gearbox oil change on a wind turbine :
KPIs for a gearbox oil change on a wind turbine :
Using all members of the team we carried out a brainstorming session and applied it to a fishbone diagram.
As a group we decided on our KPIs for the task. The KPIs for the task were largely guided by the overall KPIs of the wind generation department.
As a group we decided on our KPIs for the task. The KPIs for the task were largely guided by the overall KPIs of the wind generation department.
We used five headings:
- Time
- Cost
- Method
- Safety and Environmental
- Compliance
Along with times taken from the SCADA system and a site visit with turbine technicians we assembled process diagram :
Process analysis work sheet : costs : Manual method compared with Oil exchange truck
The process analysis allowed compilation of task specific costs with each method. The image attached has the actual costs blanked out.

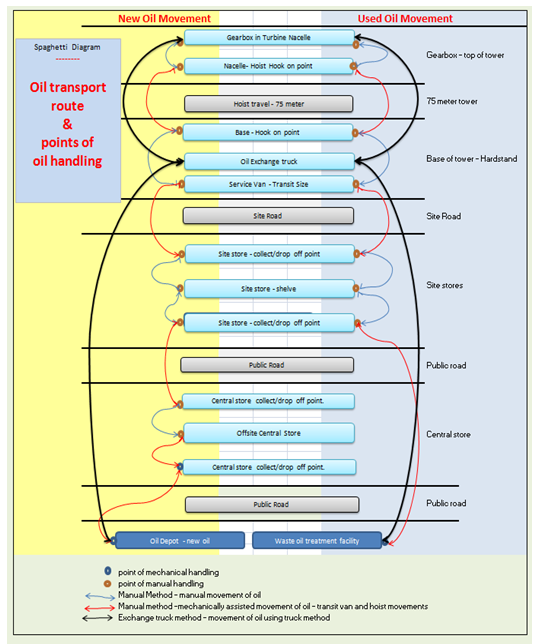
A spaghetti diagram was constructed to show the movement path of the oil with respect to each method of oil change. This also allowed me to identify likely opportunities for manual handling injuries, oil spills and falling objects.
Baseline costs and time
The cost of the truck method is approx. 20% more expensive
The cost of the truck method is approx. 20% more expensive
Review of Measure:
Enough information has now been gathered to examine the performance of the critical to quality characteristics. The most difficult of this phase was to simply collect information, and not try to start fixing things as we went along. The team is spending more time than expected on the project.
The visual effectiveness of the spaghetti diagram came as the greatest surprise to all the team members.
The visual effectiveness of the spaghetti diagram came as the greatest surprise to all the team members.


No comments:
Post a Comment