Sunday, 12 April 2015


Control                                    
1. Implement ongoing measurement – How will the process be measured after the project?
The process will controlled and measured using the Critical to Quality KPIs.
Control plans for KPIs


2. Standardise the decision making process – Have the changes become business as usual?

Flow chart


3. Standardise the process

Standardise each component of the activity, Ensure the task is allowed to flow. Keep documentation to a safe minimum. Paperwork is designed to allow the job to progress, if it causes delays then the process needs to be reviewed.


4. Quantify the improvement – Has the project goal been achieved?

The project has identified that there are cost/time/safety/environmental differences that can be attributed to both oil change methods.

The conclusion of the project is that using the oil change truck is the overall preferred option.


Friday, 27 March 2015

Improve

Generate potential solutions – What are all the different possible solutions?

Negative brainstorming – We completed a negative brainstorming session to identify possible failures and then identify the control measures in place.


Assess the risks – What are the risks of implementing the solutions ?
Following on we expanded the negative brainstorming session with a FMEA


Select the best solution – which solutions are most likely to work?

Using the information compiled and analysed throughout the previous stages, we are steadily coming to the conclusion that the truck method is the preferred method of oil change. The planning scope for the scheduled oil changes needs to include dates, consumables, manpower, tools  and machinery. Up to now the importance was placed on achieving target dates by whatever method was readily available. From now on the focus is on planning the resources to achieve the dates

Solution screening


Assessment Criteria - KPIs


Pilot and implement – When, where and how will the solution be implemented

There will be times when manual oil changes will need to be carried out through necessity, specifically due to failures within gearboxes that require oil exchange after repair.


5S – Identify which method (truck/Manual) to be used in different situations

 
Visual Management – create task specific visual aids. These aids will encourage the service team to stay safe while achieving planned target dates with efficient oil changes.


Conclusion for improve.
We have identified the  truck method as preferred, based on a number of KPIs.
We have identified that the preferred method may not always be possible due to lack of tool and machinery resources. In this case the manual option will be used.


Friday, 13 March 2015

Analyse stage


Analyse
Analyse the process
How does the process actually work -
Time value map for the oil change only. Time is mapped on the assumption that the oil truck is parked at the base of the turbine ready to go, and the service van is parked at the base of the turbine with an oil change worth of 20 litre container and ready to go. VA is only added to tasks directly changing oil at the gearbox.  This excludes time/costs incurred for the manual method with regards storage and transportation of the oil as far as the base of the turbine.
We created a matrix to show the Value and Non Value Added tasks.


Using the time taken for the manual method as a baseline:


We generated a pie chart to compare VA and NVA time during the oil changes. We decided to used the greater time taken for the manual oil change as the reference time. This allowed the time saved in the truck oil change method to be presented as value added time.

Cost:  Comparison and cost : VA, Unavoidable NVA, Avoidable NVA and potential  NVA
We broke the tasks into value and non-value added . We compared the costs in carrying out once off oil changes, which may need to be carried out in an unscheduled manner, possibly due to a breakdown. We also compared carrying out 3 oil changes in one day. 3 oil changes in one day would be representative of normal scheduled service oil changes.
 
Seven Wastes : Identify wastes

Taking the seven wastes and a few of the new wastes a comparison table was created.

Develop theories and ideas
What does the existing process knowledge say -


5 Why’s – Oil truck Method
Why use the oil truck? Use the oil truck because it is faster
Why is it faster? There is less manual handling involved
Why is there less manual handling involved? The truck pump and drains the oil directly at the gearbox.
Why pump and drain the oil directly at the gearbox? It reduces opportunity for falling items and manual handling incidents.
Why is reducing opportunity for falling items and manual handling incidents an advantage? This reduces the chances of personnel getting hit by falling objects, reduces the chances of oil spills due to dropped containers and lost time due to manual handling/back injury.
 

5 Why’s – Manual method

Why use the manual method? The truck is not available
Why is the truck not available? The oil change wasn’t scheduled
Why wasn’t the oil change scheduled?  It was a once off oil change due to a mechanical fault

Why not wait for an oil truck? The cost of the downtime outweighs waiting for the truck.
Why is the cost of downtime so important? The turbine generates an income when it’s running. The performance of the wind turbine is measured by its annual running time.

Analyse the data:
We created a matrix outline the costs, safety and environmental elements of the oil changes.
Conclusion for Analyse
Elements of analyse were painstaking, but the clear impact picture that was created of the  elements of the oil changes will provide the valuable information required to drive the improvements.

Saturday, 21 February 2015

Measure stage


Measure Stage
Develop process measures How do you measure the problem?
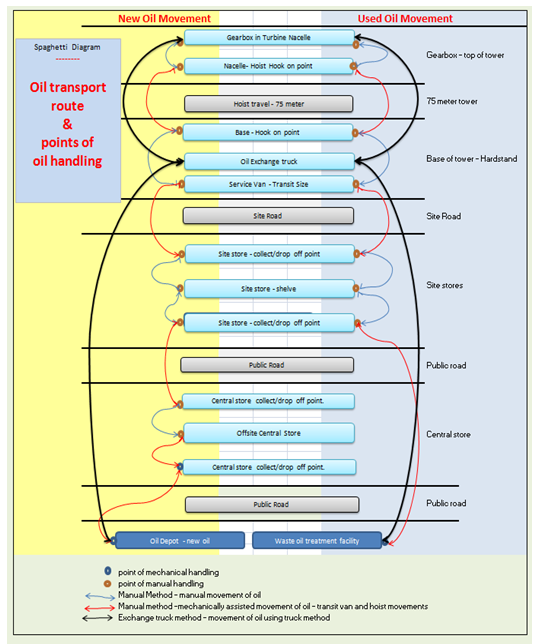
For the measure stage we decided to measure how strongly linked the task is to our overall department KPIs. Using a fishbone chart, a process flow chart, a process analysis work sheet and a spaghetti diagram we identified the critical to quality components of the task that required to be measured.
Collect process data - When and where does the data come from?

KPIs for a gearbox oil change on a wind turbine :
Using all members of the team we carried out a brainstorming session and applied it to a fishbone diagram.
As a group we decided on our KPIs for the task. The KPIs for the task were largely guided by the overall KPIs of the wind generation department.
We used five headings:
  1. Time
  2. Cost
  3. Method
  4. Safety and Environmental
  5. Compliance

Along with times taken from the SCADA system and a site visit with turbine technicians we assembled process diagram :
Process analysis work sheet : costs : Manual method compared with Oil exchange truck

The process analysis allowed compilation of task specific costs with each method. The image attached has the actual costs blanked out.

A spaghetti diagram was constructed to show the movement path of the oil with respect to each method of oil change. This also allowed me to identify likely opportunities for manual handling injuries, oil spills and falling objects.

 Baseline costs and time
 The cost of the truck method is approx. 20% more expensive

Review of Measure:
Enough information has now been gathered to examine the performance of the critical to quality characteristics. The most difficult of this phase was to simply collect information, and not try to start fixing things as we went along. The team is spending more time than expected on the project.
The visual effectiveness of the spaghetti diagram came as the greatest surprise to all the team members.


Friday, 6 February 2015


The Project:

Using DMAIC along with lean principles and  quality tools, this project will work to identify and implement the most time and cost effective method of gearbox oil exchange on a multi mega-watt industrial wind turbine, whilst maintaining a high focus on safety and environmental impact.

 I will be using "Lean Six Sigma and Minitab" 3rd edition, along with the lecture notes/templates and guidance from my supervisor, to progress the project.

Define Stage:

After identifying the potential project, I assembled a team along with assistance from my manager and the other stakeholders. We had an initial kick off meeting that outlined how the project would flow and the expected input that would be required from the various stakeholders.

 Using  "Lean Six /Sigma and Minitab" as a guide. It was possible to break the define stage into sub-stages.

  • Define the Business case :
  • What's wrong? What do you want to achieve?
  •  tools used - Problem  Statements, Goal Statements, Cost of Poor Quality
  •  
  • Understand the customer :
  • How does the problem link to the customer ? 
  • tools used - Voice Of the Customer (direct contact method), Kano Analysis, Critical to Quality Tree
  •  


  • Define the process  :
  • Are you clear which process the problem relates to ?
  • tools used - SIPOC process map
  •  
     
     
  • Manage the project :
  • Who?  Where? When? How?
  • tools used - Project structure and plan, Stakeholder analysis, identify facilitation skills to be used to progress the project, select a cross functional team, identify communication methods for the various stakeholders, develop a gantt chart for the expected project duration.
  •  
     
     
  • Gain Project approval :
  • Does the project have buy in to proceed and succeed ?
  • tools used - Project Charter  - Gain clear sponsorship from senior management.

Conclusion at define stage:
Using "Lean Six Sigma and Minitab" as a guide, a clear outline has been identified on defining all aspects and stakeholders associated with the problem. It gives a clear outline on where the process is at the moment, where we need to get to and how we are going to get there. I developed a greater appreciation on the effects and inputs required from the teams that work in the background and don't appear out at the turbine on the day of the oil exchange, i.e. commercial team, stores and logistics, environmental team.